This page should be read in conjunction with How Plume Plotter Works. It provides more details specific to the Barry version of Plume Plotter.
Building measurements are taken from [2].
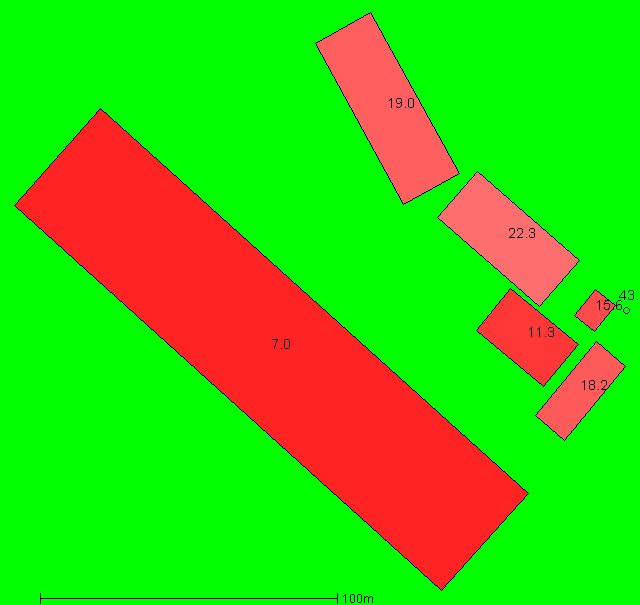
This image shows the layout of the stack and buildings modelled:
All of these are taken from [1] except the stack location which is taken from [2]:
The following values are used for albedo, Bowen ratio and roughness length. None of these are specified in [1] or [2]:
The emission rates of pollutants are taken from [1]. These are:
| Pollutant | Emission rate per second |
|---|---|
| Oxides of nitrogen | 4.32 g |
| Particulates | 216 mg |
| TOC | 216 mg |
| Hydrogen chloride | 216 mg |
| Hydrogen flouride | 21.6 mg |
| Carbon monoxide | 1.08 g |
| Sulphur dioxide | 1.08 g |
| Ammonia | 108 mg |
| Cadmium and thallium | 1.08 mg |
| Mercury | 1.08 mg |
| Other metals | 10.8 mg |
| Dioxins and furans | 2.16 ng |
| PaHs | 21.6 μg |
| PCBs | 108 μg |
The background levels of pollutants are taken from [1]. These are:
| Pollutant | Background concentration per m3 |
|---|---|
| Oxides of nitrogen | 20 μg |
| Particulates | 13.5 μg |
| TOC | 350 ng |
| Hydrogen chloride | 240 ng |
| Hydrogen flouride | 500 ng |
| Carbon monoxide | 140 μg |
| Sulphur dioxide | 2.2 μg |
| Ammonia | 990 ng |
| Cadmium and thallium | 300 pg |
| Mercury | 2 ng |
| Other metals | 54.49 ng |
| Dioxins and furans | 28.8 fg |
| PaHs | 330 pg |
| PCBs | 440 pg |
Weather data is taken from METAR reports from a local airport: Cardiff.
Upper air data is the latest reported by the Camborne upper air station.