This page should be read in conjunction with How Plume Plotter Works. It provides more details specific to the Horsham version of Plume Plotter.
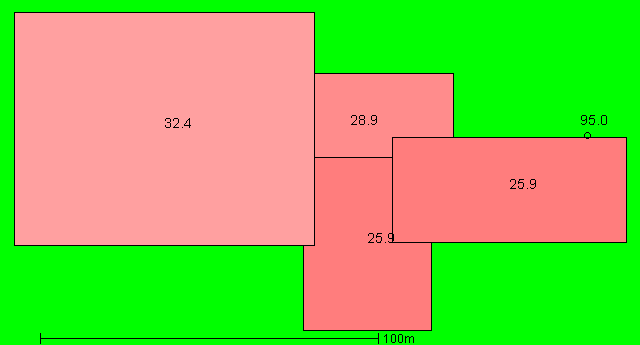
Building measurements are taken from [1]. This image shows the layout of the stack and buildings modelled. North is at the top; colours and numbers indicate the heights of the buildings and the stack:
All of these are taken from [1]:
The following values are used for albedo, Bowen ratio, and roughness length. Roughness length is as specified in [1]:
The emission rates of pollutants are taken from [1]. These are:
| Pollutant | Emission rate per second |
|---|---|
| Oxides of nitrogen | 9.7 g |
| Sulphur dioxide | 2.4 g |
| Carbon monoxide | 2.4 g |
| Particulates | 500 mg |
| Hydrogen chloride | 500 mg |
| Hydrogen flouride | 50 mg |
| Cadmium and thallium | 2 mg |
| Mercury | 2 mg |
| Other metals | 24 mg |
| Benzo(a)pyrene | 480 μg |
| Dioxins and furans | 4.8 ng |
| PCBs | 240 μg |
The background levels of pollutants are taken from [1]. These are:
| Pollutant | Background concentration per m3 |
|---|---|
| Oxides of nitrogen | 11.9 μg |
| Sulphur dioxide | 1.57 μg |
| Carbon monoxide | 250 μg |
| Particulates | 24 μg |
| Hydrogen chloride | 390 ng |
| Hydrogen flouride | 2.46 μg |
| Cadmium and thallium | 250 pg |
| Mercury | 2.47 ng |
| Other metals | 39.75 ng |
| Benzo(a)pyrene | 230 pg |
| Dioxins and furans | 26.7 fg |
| PCBs | 64.4 pg |
Weather data is taken from METAR reports from a local airport: London Gatwick.
Upper air data is the latest reported by the Herstmonceux upper air station.