This page should be read in conjunction with How Plume Plotter Works. It provides more details specific to the Whistleberry version of Plume Plotter.
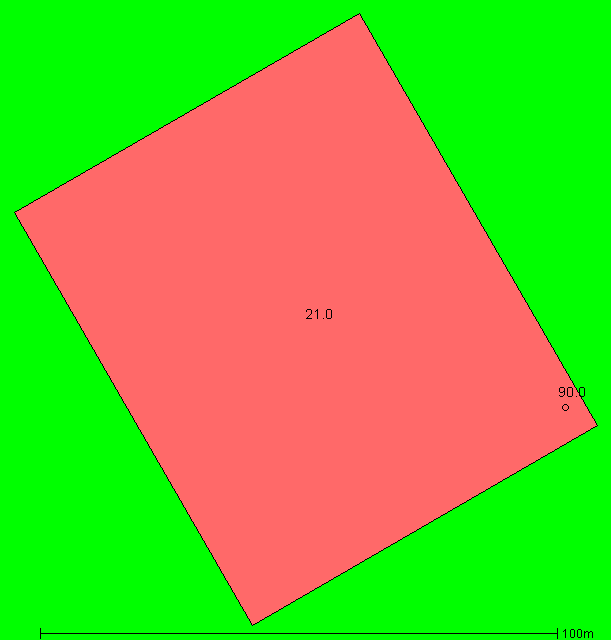
The incinerator building is much shorter than the stack and not expected to affect the plume, but the main building has nevertheless been included in our model. Building measurements are taken from the site layout which is also included in [2].
This image shows the layout of the stack and buildings modelled:
All of these are taken from [2] except the stack location which is not stated but was calculated from the site layout included in [2]:
The following values are used for albedo, Bowen ratio and roughness length. The "urban option" of AERMOD was used. None of these are specified in [1] or [2]:
The emission rates of pollutants are taken from [2]. These are:
| Pollutant | Emission rate per second |
|---|---|
| Oxides of nitrogen | 7.56 g |
| Particulates | 378 mg |
| TOC | 378 mg |
| Hydrogen chloride | 378 mg |
| Hydrogen flouride | 37.8 mg |
| Carbon monoxide | 1.89 g |
| Sulphur dioxide | 1.89 g |
| Ammonia | 264.6 mg |
| Cadmium and thallium | 1.89 mg |
| Mercury | 1.89 mg |
| Other metals | 18.9 mg |
| Dioxins and furans | 3.78 ng |
| PaH | 378 μg |
| PCB | 189 μg |
The background levels of pollutants are taken from [1]. These are:
| Pollutant | Background concentration per m3 |
|---|---|
| Oxides of nitrogen | 14.7 μg |
| Particulates | 12.7 μg |
| TOC | 450 ng |
| Hydrogen chloride | 240 ng |
| Hydrogen flouride | 3 μg |
| Carbon monoxide | 150 μg |
| Sulphur dioxide | 2.1 μg |
| Ammonia | 1.4 μg |
| Cadmium and thallium | 300 pg |
| Mercury | 2 ng |
| Other metals | 54.53 ng |
| Dioxins and furans | 28.8 fg |
| PaH | 330 pg |
| PCB | 440 pg |
Weather data is taken from METAR reports from a local airport: Glasgow.
Upper air data is the latest reported by the Albemarle upper air station.