|
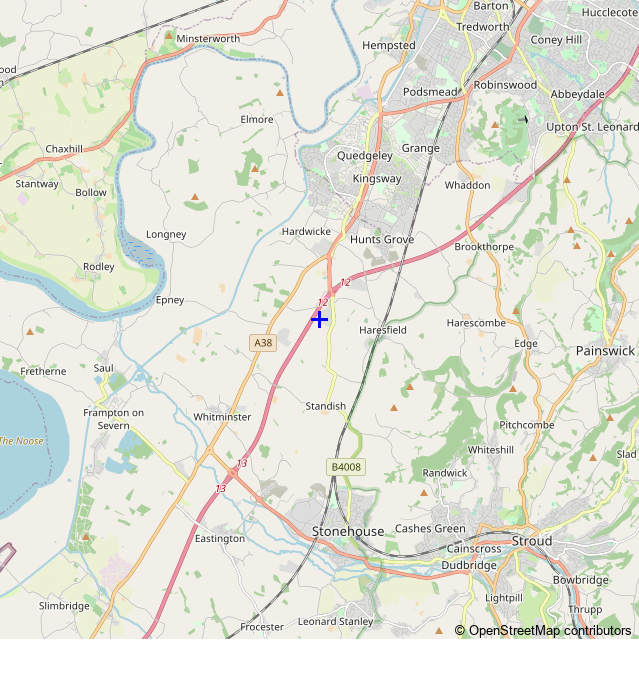
The map shows the (predicted) current state of pollution from the incinerator at Javelin Park. The red line shows wind direction. Green rings show distance (km). Colours show concentration of oxides of nitrogen at ground level. Maximum: 3.64 µg/m3. This is the concentration at the location that is most polluted by the plume. Breakdown of pollutants at most polluted location (green = background, red = added by plume): Oxides of nitrogen
Sulphur dioxide
Carbon monoxide
Particulates
Hydrogen chloride
Hydrogen flouride
VOCs
Ammonia
Mercury
Cadmium and thallium
Other metals
Dioxins and furans
Benzo(a)pyrene
Oxides of nitrogen
Sulphur dioxide
Carbon monoxide
Particulates
Hydrogen chloride
Hydrogen flouride
VOCs
Ammonia
Mercury
Cadmium and thallium
Other metals
Dioxins and furans
Benzo(a)pyrene
| |||||||||||||||||||||||||||||||||||||||||||||||||||||||||||||||||||||||||||||||||||||||||||||||||||||||||||||||||||||||||||||||||||||||||||||||||||||||||